
Overview
The Tags report enables you to explore the types of conversations your team is having and monitor trends in the topics that arise. It highlights the number of tagged conversations over time, reply time per tag, and more. You'll be able to understand deeply what categories of communication are occurring, what categories to invest more training in, and operational efficiencies for these categories. Tags are flexible and can track many use cases ranging from categories of interest and customer sentiment.
Take a Front Academy course here to learn more about leveraging Front analytics to achieve your goals.
Report sections
Conversations With Tags bar

Features
The Conversations With Tags bar shows the percentage breakdown of tagged vs. untagged conversation on this time period. If your goal is to track the conversations occurring with your team, then you want to aim for a high percentage of conversations being tagged.
Click on each metric to see the metric details-- how it was calculated and which conversations were counted into the metric.
Tag Details table
Features
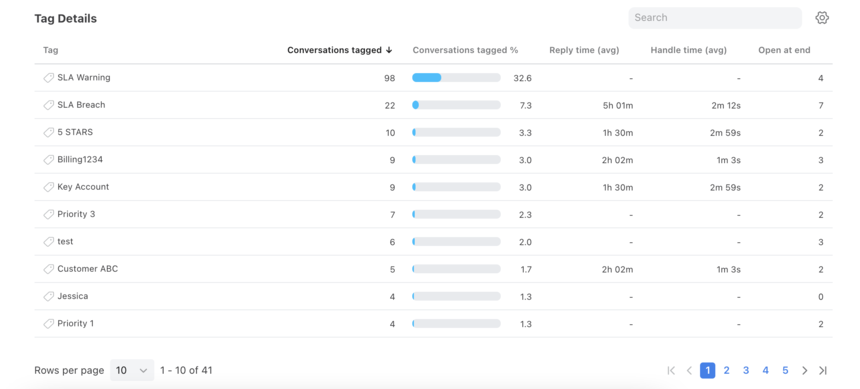
The Tag Details table shows specific metrics for each of your tags during the selected period. This allows you to gain insight into the efficiency, volume, and performance patterns.
Both parent tags and nested tags show in the table.
Type in the search box to find specific tags.
Click the gear icon at the top right of this table to select which metrics you want to display, listed below.
Customize how many rows you'd like to display on each page using the Rows per page on the bottom left.
Click to more pages using the arrows and numbers on the bottom right.
Click on each metric to see the metric details-- how it was calculated and which conversations were counted into the metric.
List of metrics
Tag Changes table
Features
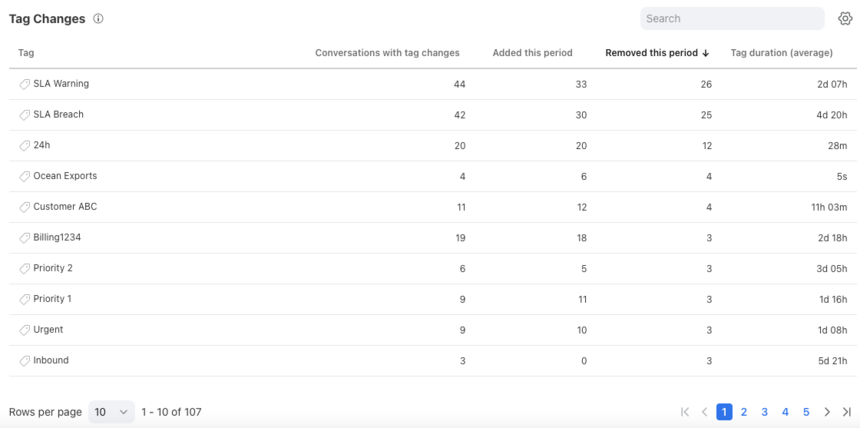
The Tag Changes table shows specific metrics for any tag that was added or removed during the period. This allows you to gain insight into processes that use tags.
Customize how many rows you'd like to display on each page using the Rows per page on the bottom left.
Click to more pages using the arrows and numbers on the bottom right.
If results seem unusual, check your filter settings. If you're filtering for tags that are currently applied to conversations, not all tag changes will be shown
List of metrics
Instructions
Set up a new report view by following this guide.
Pricing
Analytics are available on the Growth plan or above. Some legacy plans may also allow access to this feature.